
Performance
PageSpeed >95 out of 100.
No accident.
Google rates websites by speed, accessibility, best practices and SEO. Our scores speak for themselves — and for the websites we build for our clients.
Google PageSpeed Insights
These are our real numbers.
No test server, no empty demo — this is the live production site of web-n-search.de, measured with Google PageSpeed Insights. The same standards apply to every site we build.
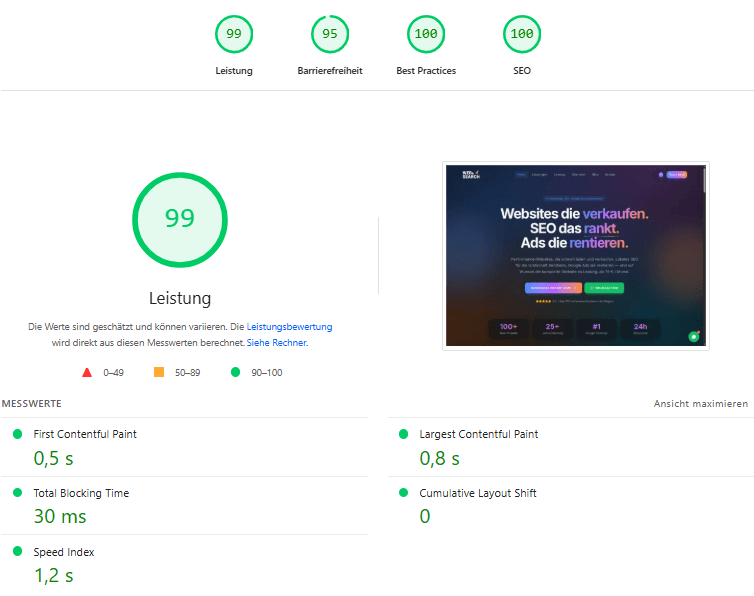
Core Web Vitals
The numbers in detail.
Google uses these metrics to decide whether your site is fast enough — for visitors and for ranking.
Why this matters
Slow websites cost money.
53% of mobile visitors abandon a site that takes longer than 3 seconds to load. Google penalizes slow sites with worse rankings. These are the typical issues:

Long load times
Visitors bounce, Google demotes you. Every second of load time costs you 7% conversion.
Layout shifts (CLS)
Jumping content annoys visitors and has been a direct Google ranking factor since 2021.
Render-blocking JavaScript
WordPress plugins load tons of unused JS — your visitor waits while the browser works.
Unoptimized images
Huge JPEGs instead of modern formats like AVIF/WebP. Your mobile visitor pays with data and patience.
Comparison
WordPress vs. site builders vs. our stack.
Average values from PageSpeed Insights for typical SMB websites.
| Performance | LCP | CLS | TBT | |
|---|---|---|---|---|
| Average WordPress site | 38 | 4.2 s | 0.31 | 1,800 ms |
| Average site builder (Wix, Jimdo) | 45 | 3.5 s | 0.18 | 1,200 ms |
| web-n-search.de | 95 | 0.8 s | 0 | 30 ms |
Sources: Google PageSpeed Insights, httparchive.org/reports (April 2026). Our values: measured live on web-n-search.de.
Our approach
How we hit these scores.
Server-Side Rendering
HTML is rendered on the server and delivered immediately — the browser shows content before JavaScript loads.
Automatic image optimization
Images are converted to AVIF/WebP at runtime and served in the right size for every device.
Minimal JavaScript
Only interactive parts load JS. Static content like text, images and navigation is plain HTML — no overhead.
Edge delivery (CDN)
Your site is served on a global CDN — whether your visitor sits in Nordhorn, Berlin or Vienna.
Core Web Vitals tuned
LCP, CLS and INP are checked on every build. Bad values block the deploy, not the visitor.
No plugin hell
No WordPress, no 40 plugins blocking each other. A clean stack, a fast site.
How fast is your website?
Find out — free website audit with PageSpeed analysis, SEO check and concrete optimization suggestions. No commitment.